<< Back to Off-topic Forum   Search

Posts 1 - 17 of 17   
zxctycxz's latest history video: 10/15/2016 16:47:54


҈ * TeeMee123҈ *
Level 55
Report
As you may know, zxctycxz has made many large historical maps on WL, achieving MotW more than anyone else. Him and I are now starting to work on the next big historical map together by the way.
On top of his warlight presence, he creates historical map timelapses (videomaps) on youtube.
His latest video is the biggest one he has ever made by far so I thought I'd share it with you people.
https://www.youtube.com/watch?v=-6Wu0Q7x5D0

Edited 10/15/2016 16:48:31
zxctycxz's latest history video: 10/15/2016 16:52:37


Tchaikovsky Reborn
Level 41
Report
Jesus...
zxctycxz's latest history video: 10/15/2016 19:30:28


Zephyrum
Level 60
Report
Didn't he already have a History of the World one? Assuming a remake?
zxctycxz's latest history video: 10/15/2016 20:27:11


Ox
Level 58
Report
His latest video is the biggest one he has ever made by far

Biggest one ever made by far*

ollie you are above human xD
zxctycxz's latest history video: 10/15/2016 21:16:24


Master Shredtail
Level 58
Report
Holy f*ck..... Ollie, I don't know how much to thank you for these contributions you've made to youtube. Very few come close to having the pure quality you've put in your videos. It's just amazing, I'm absolutely loving your channel, I'm sure countless others are feeling the same, it's just so great. Don't stop doing what you're doing. You're greatly appreciated.
zxctycxz's latest history video: 10/15/2016 22:06:35


҈ * TeeMee123҈ *
Level 55
Report
yeah, it's a remake

Edited 10/15/2016 22:07:07
zxctycxz's latest history video: 10/16/2016 00:58:36

wct
Level 56
Report
That is really epic. I love the detail! I spent at least an hour watching it in high res and repeatedly pausing it to see how it all played out. It's as much a piece of art as it is a work of history. Deserves an award, IMO.
zxctycxz's latest history video: 10/16/2016 02:22:38


Жұқтыру
Level 56
Report
I would like this, but the problem is that there are some nuances that while some maps can cover, others can't. For exemple, there's no hard proof that the Hsia House ever was, it's pseudohistory; it's part-Chinese folk religion. I mean they believe that the first emperor of the Hsia dynasty was the first human king, but his bloodline was still from the Yellow Emperor-God.

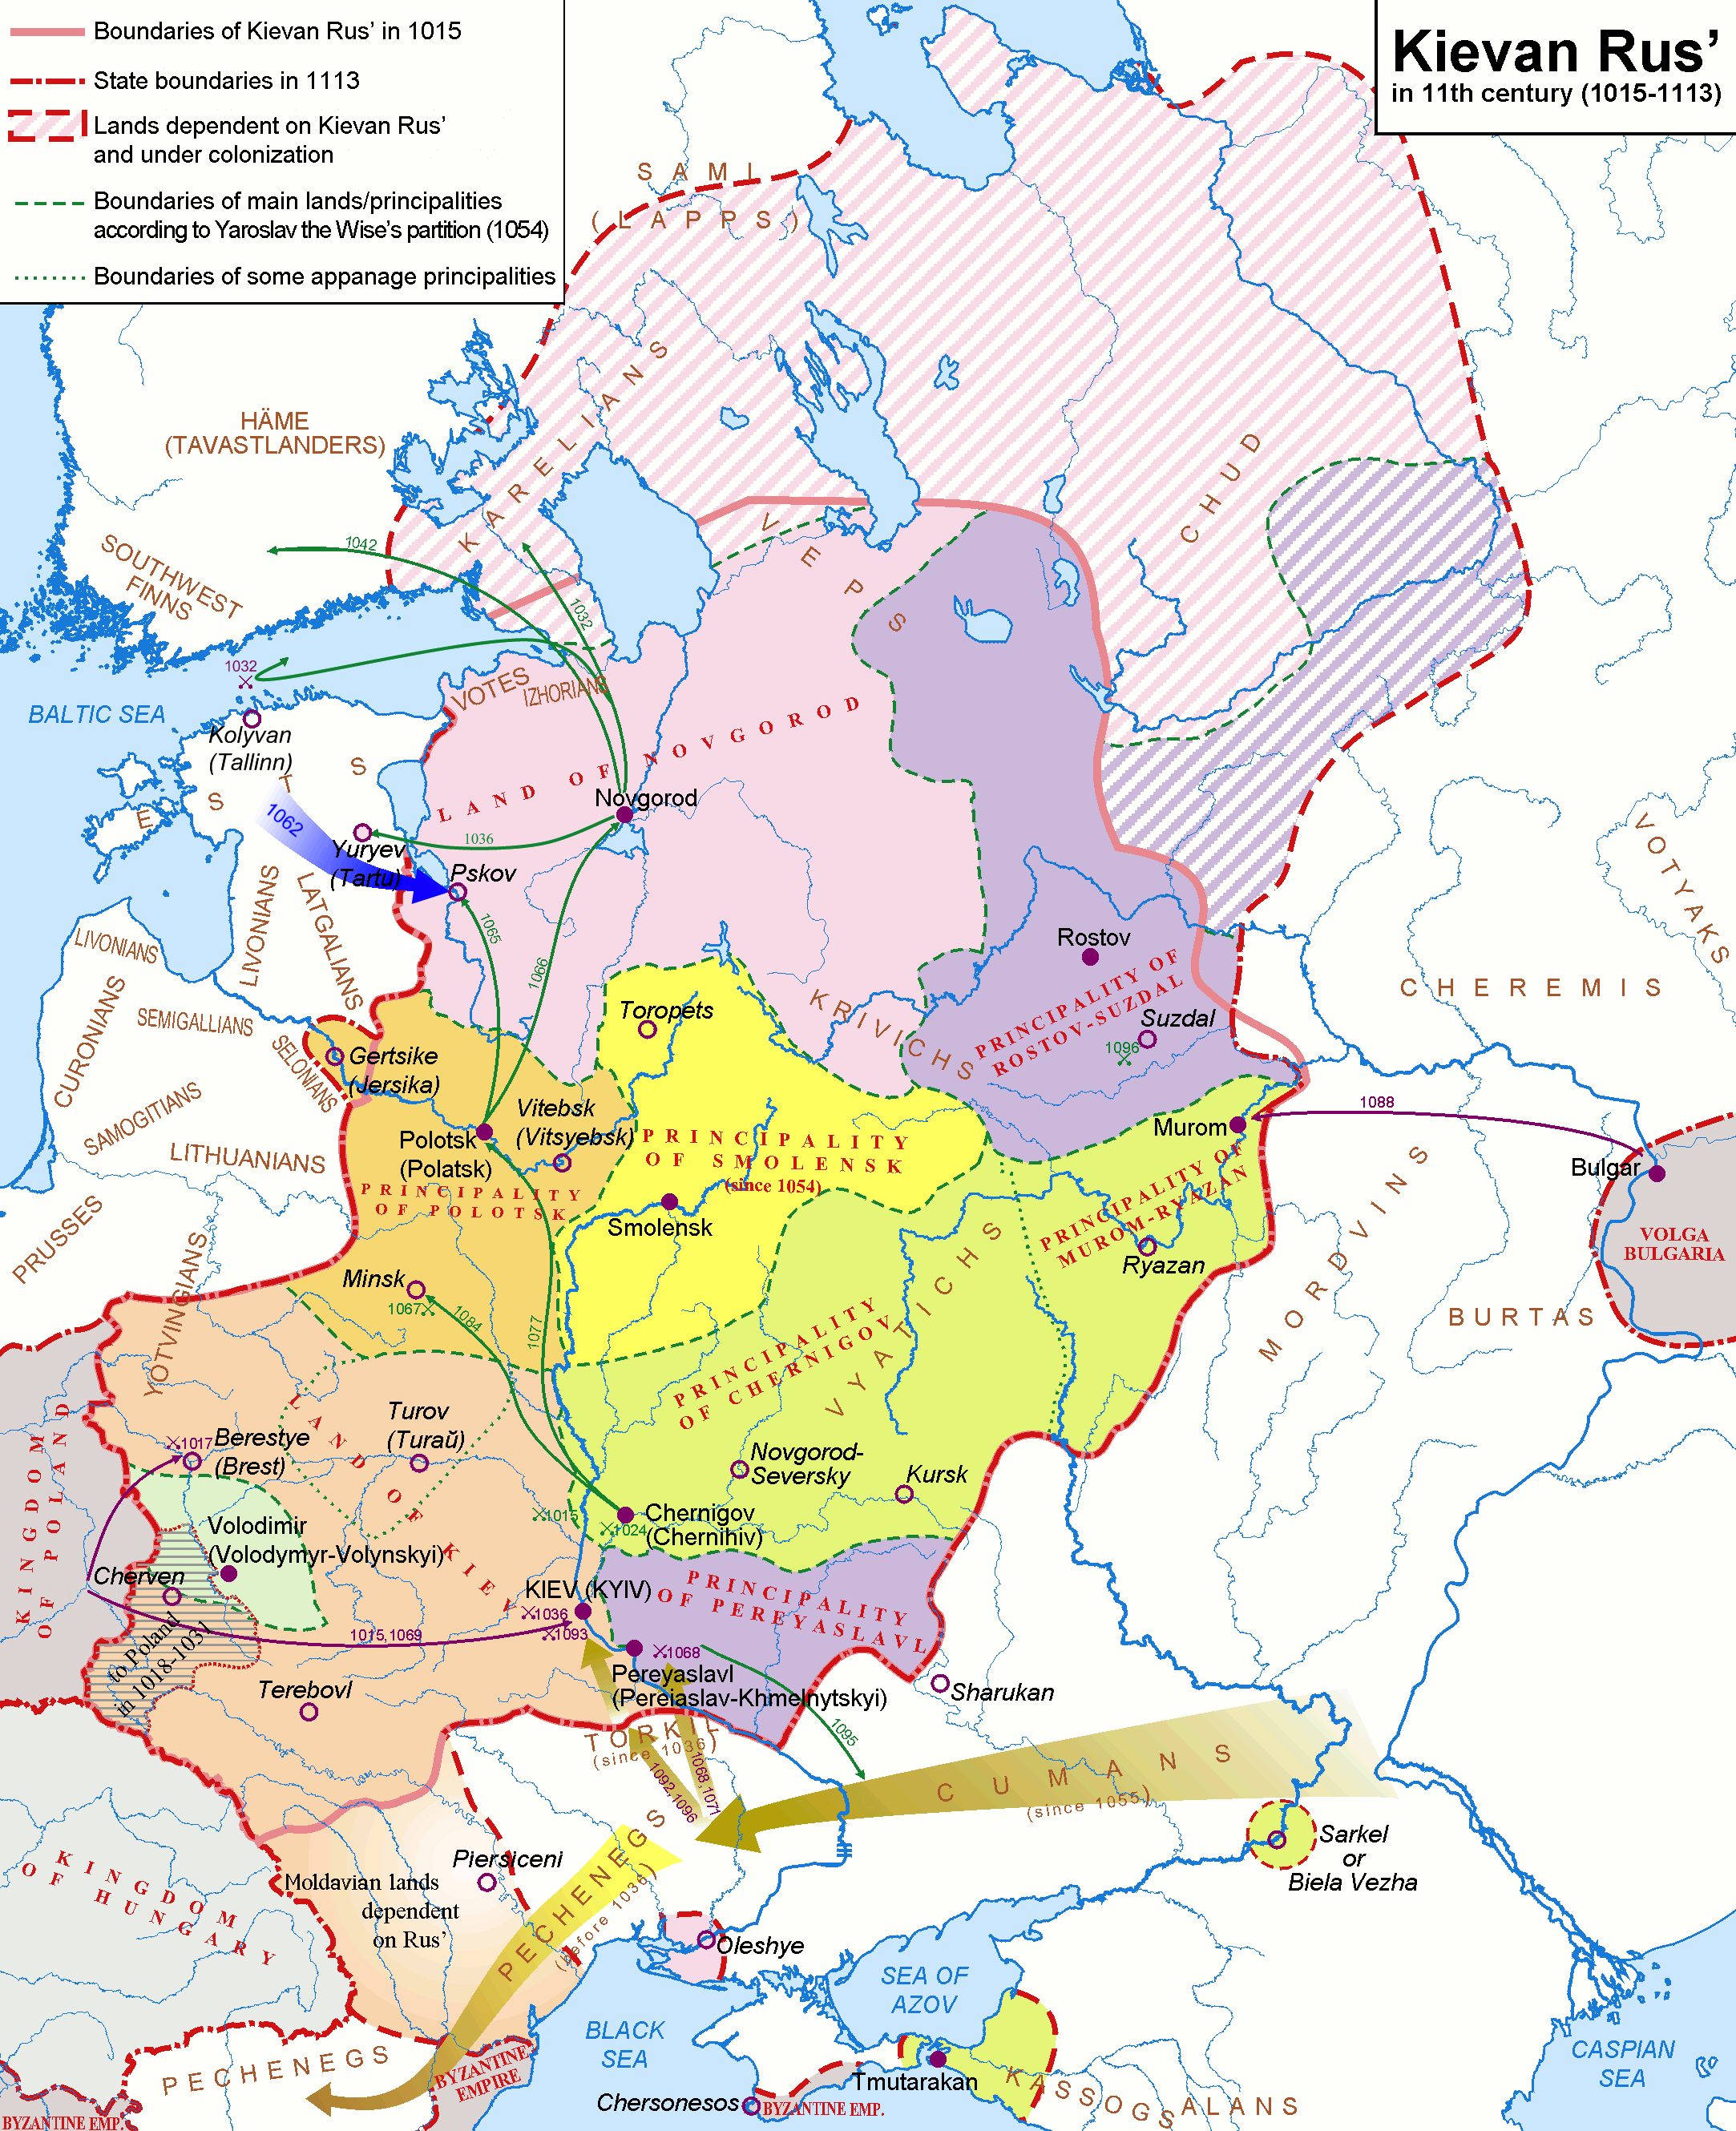
Another one is showing difering degrees of controle; marches, vassals, so on. Co-ownerships. Or faulty control. Euratlas does a pretty good job on this but to make a moving map like Euratlas would be very very hard.

Btw where are your population numbers from? They don't seem to be really based on anything, a source for it would be good.

Here's a map showing some nuances.

https://upload.wikimedia.org/wikipedia/commons/4/4e/Kievan-rus-1015-1113-%28en%29.png
(unclear borders and changes, and migrations of actual folk - not even saying anything about how this is (supposedly) one state).

Likewise: https://upload.wikimedia.org/wikipedia/commons/thumb/a/ab/Kievan_Rus_in_1237_%28ru%29.svg/708px-Kievan_Rus_in_1237_%28ru%29.svg.png?uselang=ru

Edited 10/16/2016 02:32:32
zxctycxz's latest history video: 10/16/2016 04:31:09


Zephyrum
Level 60
Report
From what I could figure he uses the known numbers at specific dates (e.g. years 0, 100, 200, 300...) and uses a formula to apply growth, then shoves all numbers on some kind of calculator and gets estimated results. They are surprisingly accurate - definetely good enough for videomapping. Gives a very good clue.
zxctycxz's latest history video: 10/16/2016 04:33:50


Жұқтыру
Level 56
Report
he uses the known numbers at specific dates (e.g. years 0, 100, 200, 300...)


But that's just the problem, they're not known and vary much from source to source.

uses a formula to apply growth


Of which there can be several different ones (opensource this pls)
zxctycxz's latest history video: 10/16/2016 15:42:59


҈ * TeeMee123҈ *
Level 55
Report
I was the guy who programmed the population extrapolator / printer for him so i can answer that.
He got the data from some atlas book and the population changes linearly between entries. It of course has a lot of false precision but it's the best you can do with the little data available (unless you do some really complex quadratic or exponential estimation which I didn't have the time to create).
It is at least accurate enough to show changes such as the decrease in population during the mongol conquests.

Edited 10/16/2016 15:47:07
zxctycxz's latest history video: 10/16/2016 17:45:37


Belgian Gentleman
Level 57
Report
It must've been a hell to do all of the research unless you love history of course
zxctycxz's latest history video: 10/16/2016 17:47:38


Lubbock
Level 36
Report
Belgian, of course they love history. Thats why they're doing this...
zxctycxz's latest history video: 10/16/2016 17:56:25


Жұқтыру
Level 56
Report
some atlas book


No offence, but this is really unspecific. And also, this goes for knowing what's the biggest borough at different points in time.

https://en.wikipedia.org/wiki/List_of_largest_cities_throughout_history

not to say that archeology is a changing science and this map might need updates.

https://en.wikipedia.org/wiki/World_population_estimates;

the population changes linearly between entries


Population does not change linearly.

https://upload.wikimedia.org/wikipedia/commons/f/f2/World_population_growth_%28lin-log_scale%29.png

complex quadratic or exponential estimation which I didn't have the time to create


http://arachnoid.com/polysolve/

and there's already been some equations made to model world population growth.
zxctycxz's latest history video: 10/16/2016 19:03:03


҈ * TeeMee123҈ *
Level 55
Report
yeah I have done this type of curve estimation thing before but I wasn't really up to it (to be honest it never crossed my mind). I hadn't even really finished the program by the time ollie has finished the slides for the video because I was planning on making it format large numbers with commas (e.g. 9000 becomes 9,000) but couldn't finish that algorithm in time

Edited 10/16/2016 19:04:46
zxctycxz's latest history video: 10/16/2016 19:14:28


Zephyrum
Level 60
Report
The point of the population pointer is to notice big spikes and valleys in population that happened in long years of peace (e.g. Pax Romana) or war (e.g Three Kingdoms, Mongol Conquest, WW1/2...), and does so with decent precision to give some scale. No complaints here on that one.
zxctycxz's latest history video: 10/16/2016 19:51:20


Жұқтыру
Level 56
Report
I know that you can show the broad points on things but the nuances, they're hard to show on a map.
Posts 1 - 17 of 17